Create a dashboard
A dashboard is created as follows:
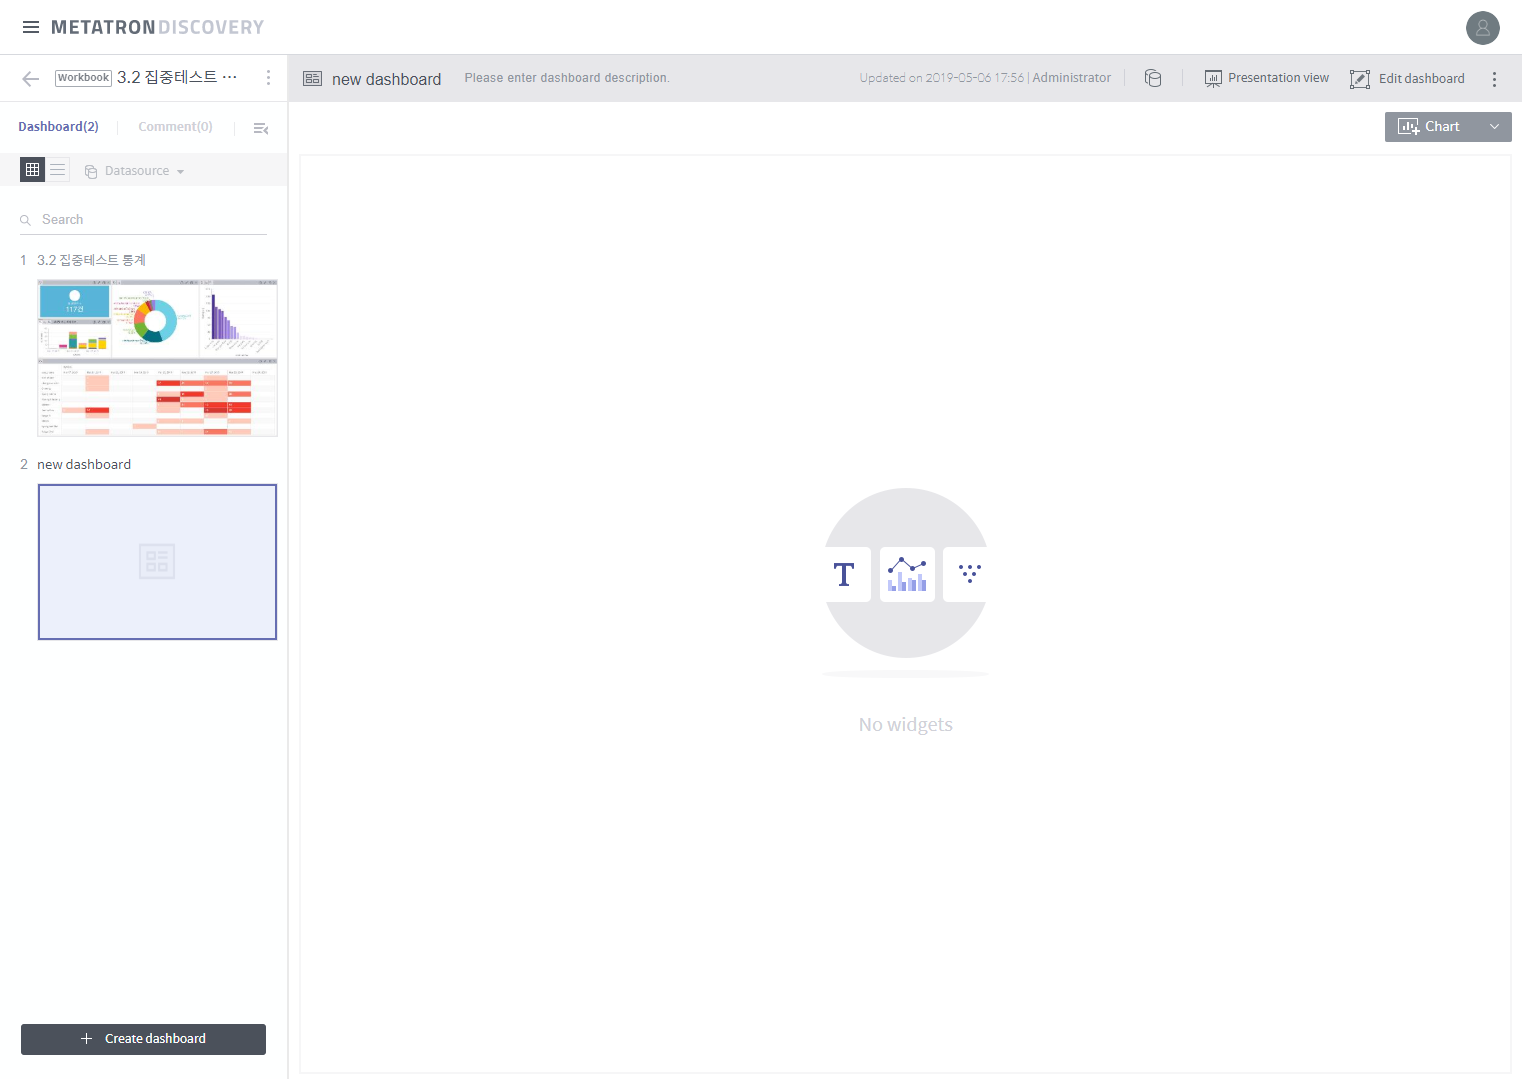
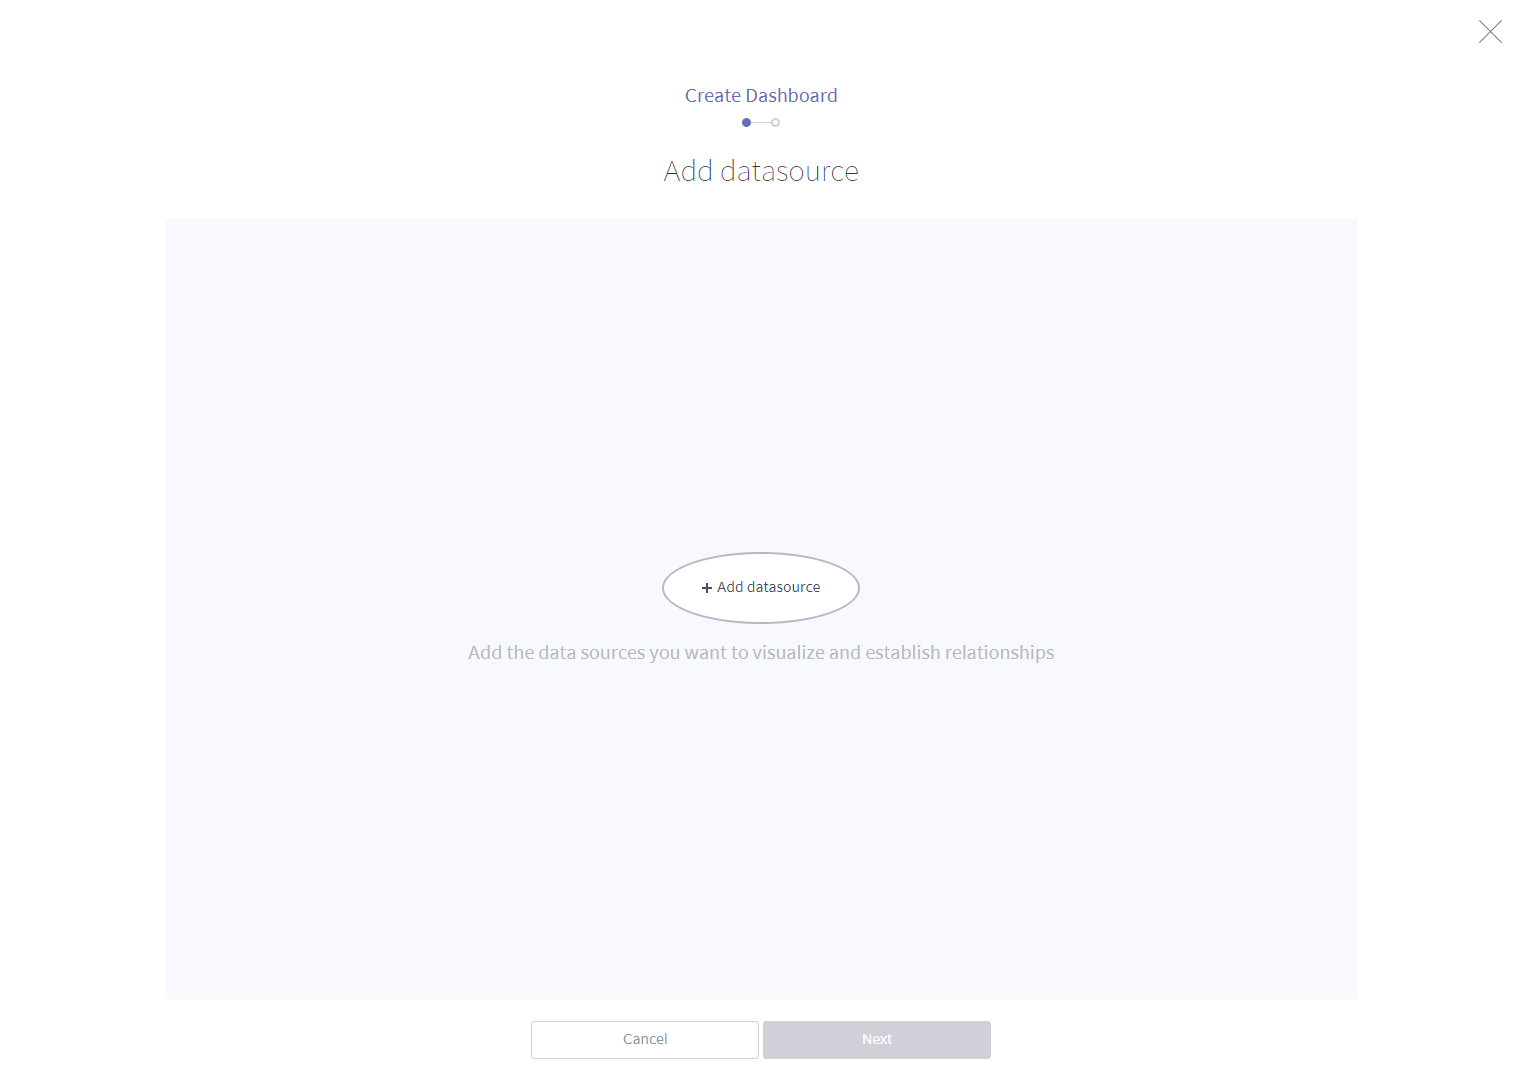
Click + Add data source on the workbook screen.
From the list of data sources accessible to the workspace, select the master data sources to which you want to connect the dashboard. In a subsequent step, you can select additional data sources to be joined to these master data sources selected here.
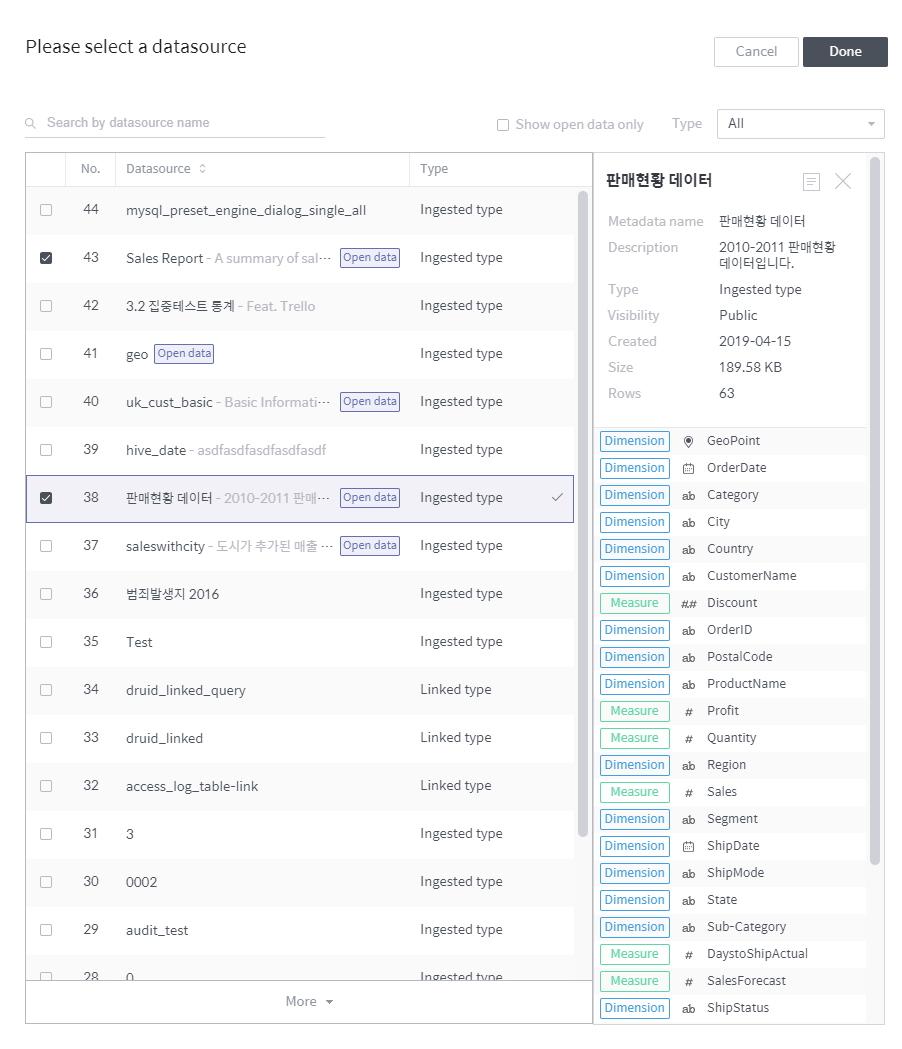
- Search by data source name: Search for a data source accessible to the workspace by name.
- Show open data only: Displays only those designated as “open data sources.”
- Type: Displays only those data sources that are the connection or collection type.
- Data source list: Lists data sources filtered by specified criteria.
- Data source information: Displays brief information of the data source selected in the list.
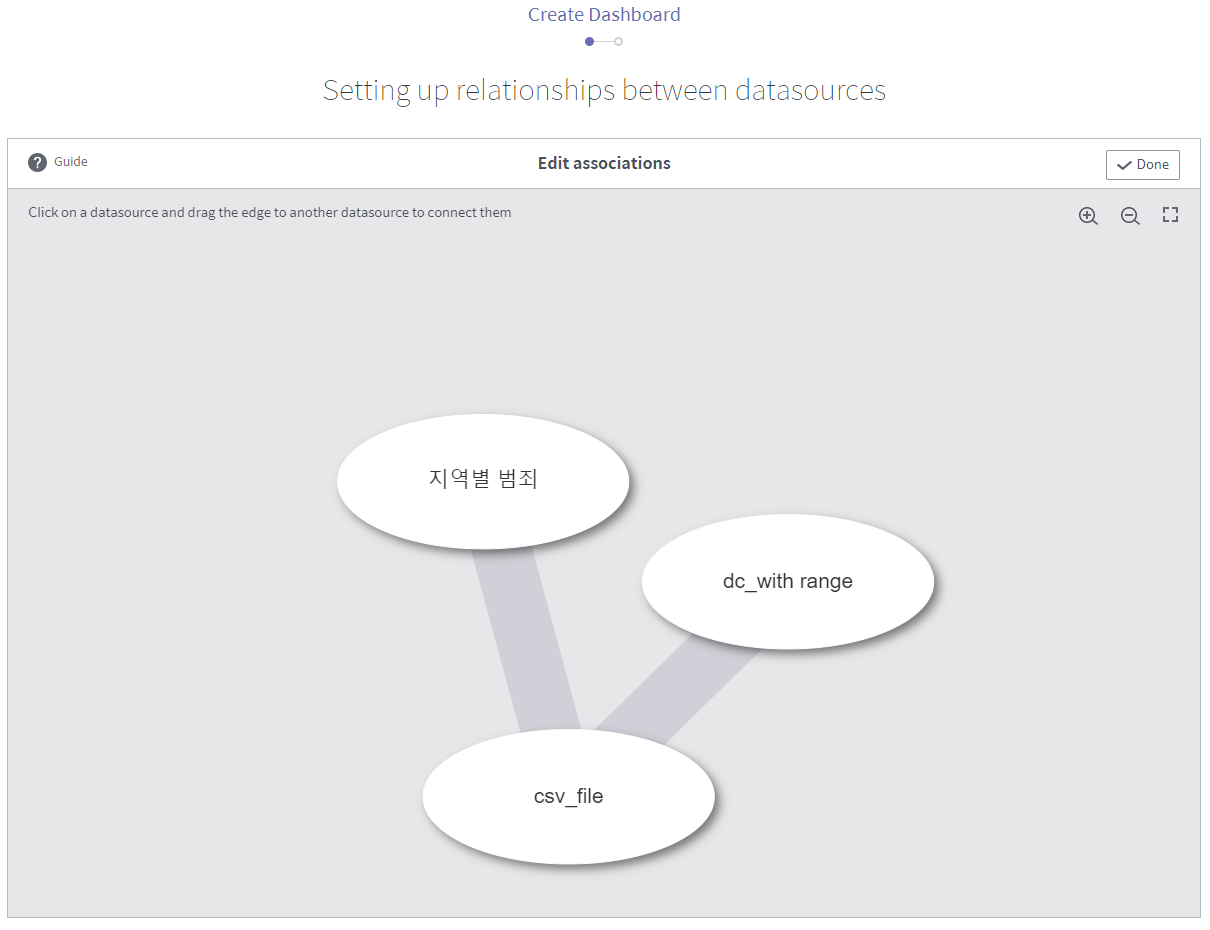
If you have selected more than one data source, you can associate them by dragging one data source to another. Associated data sources can be filtered by each other. If you do not want data source association, simply click Done.
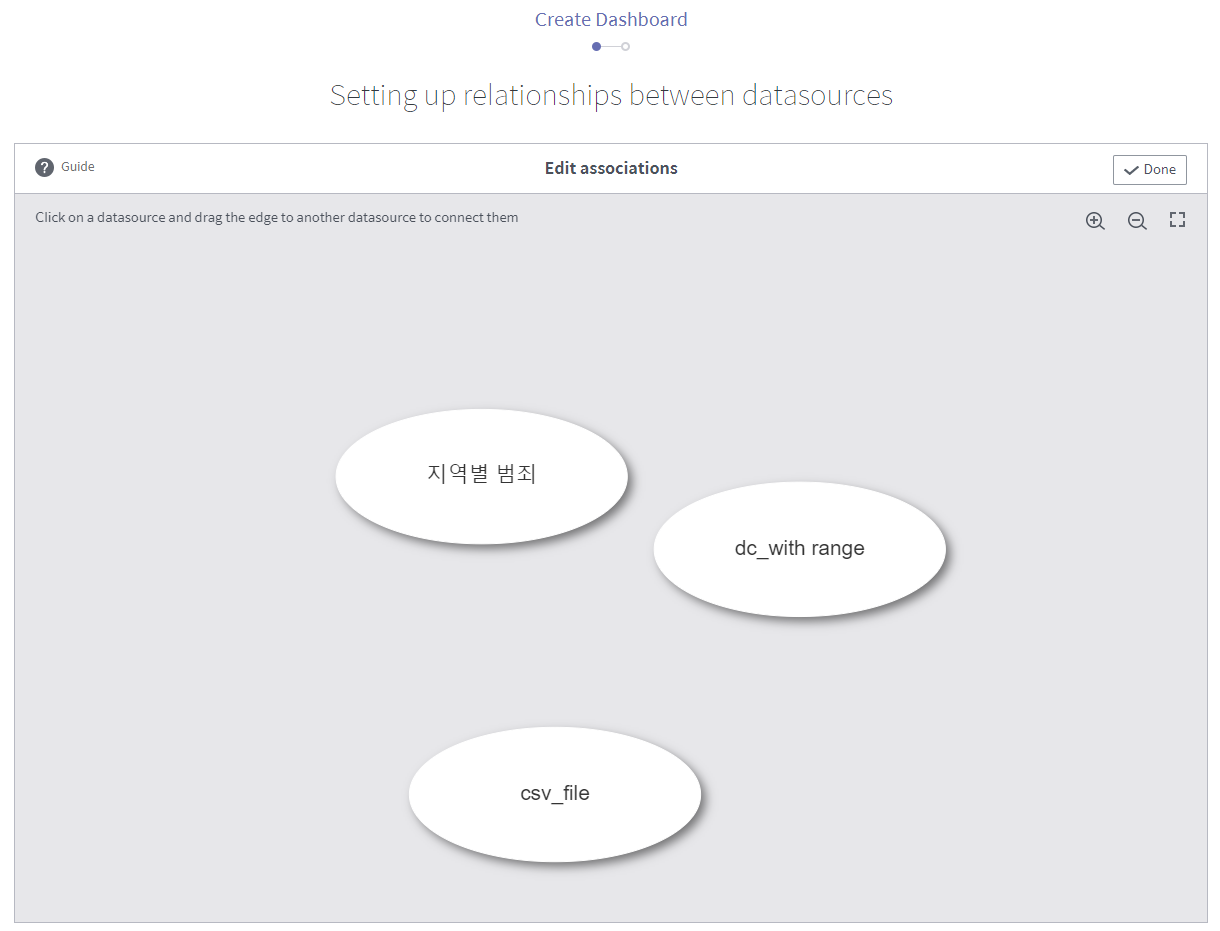
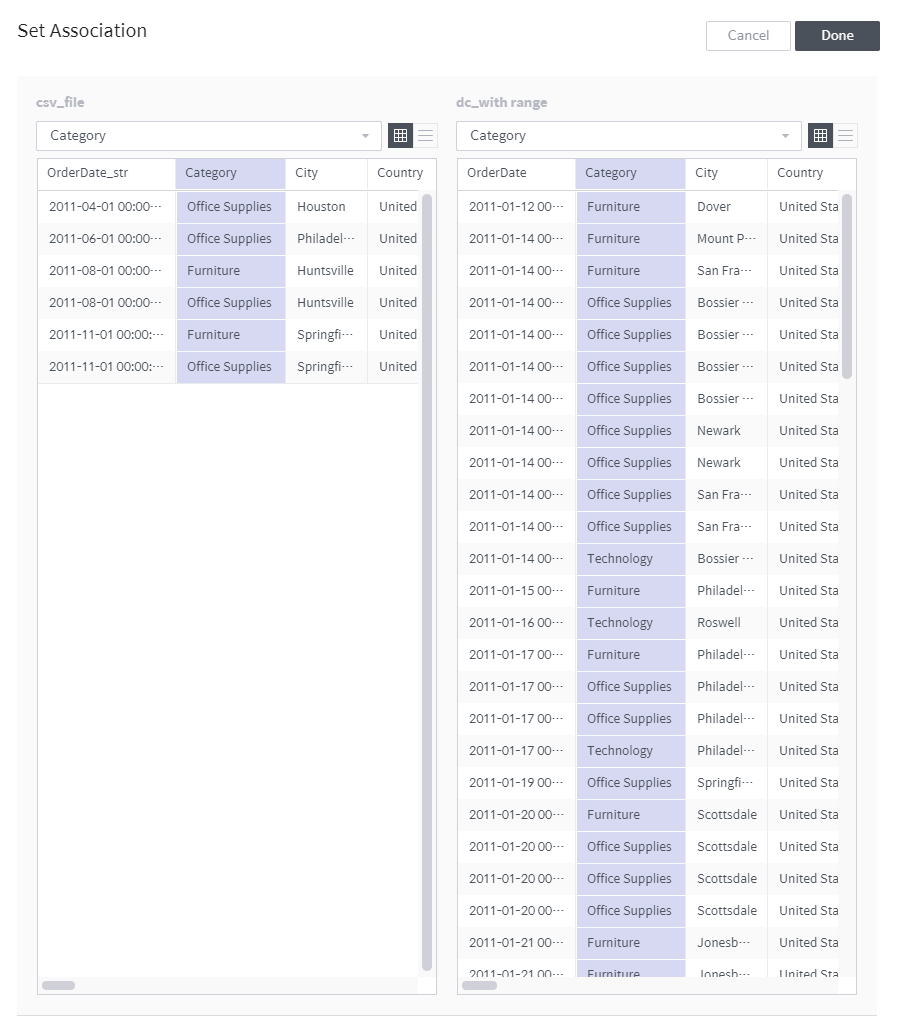
Once you drag a data source to another one, a new window will pop up to prompt you to configure the data source association. Select a column on each table as an association key by which to filter the other data source. And click Done.
Once you have finished setting up associations between the master data sources, click Done.
Re-configure master data source associations or add other data sources to be joined to the top data source selected above as described below:
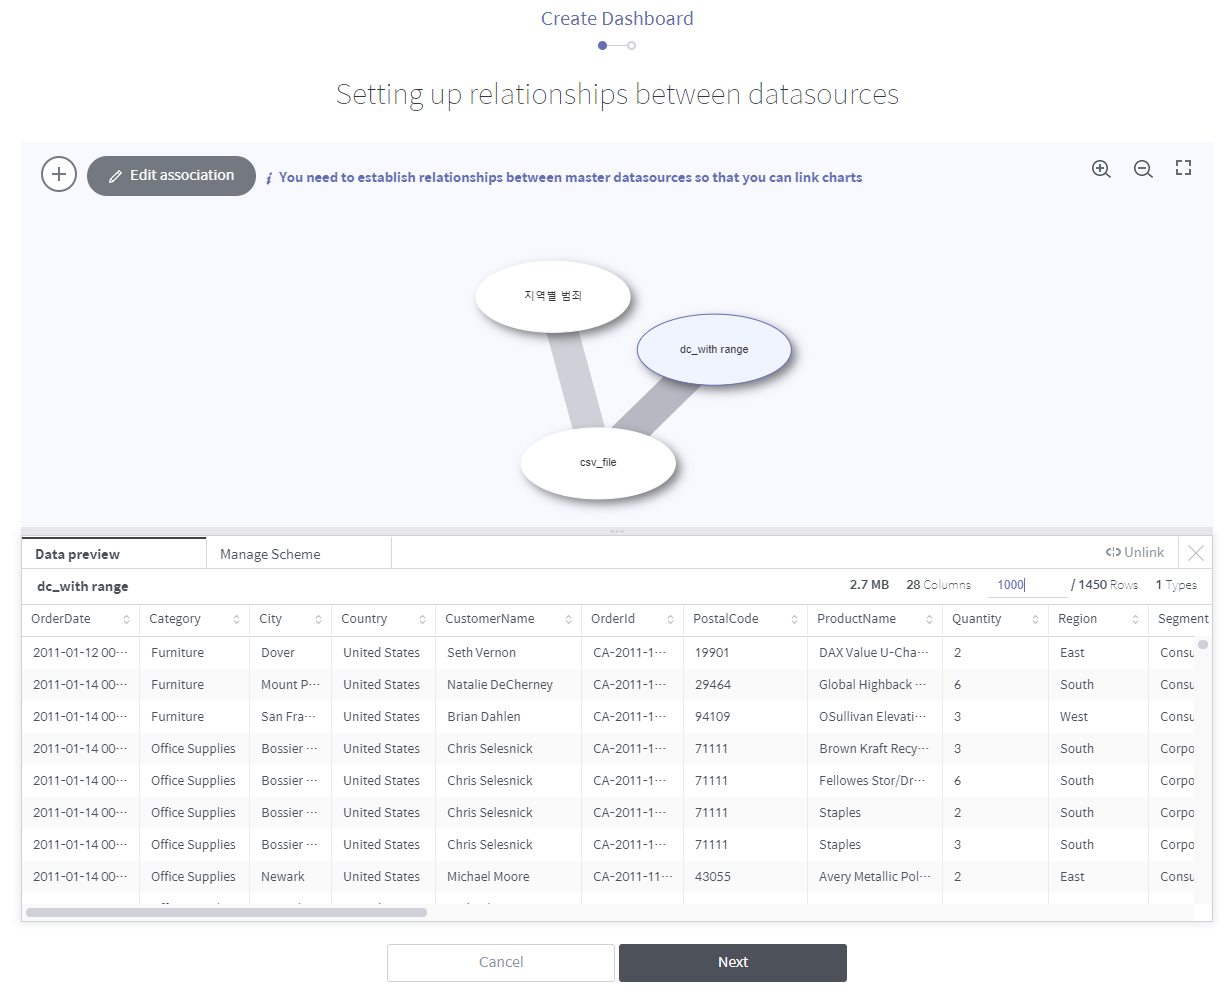
Master data source association view
: Click on it to add a new master data source.
- Edit association: Click on it to edit an established data source association.
Settings panel for individual master data sources (click one of the ovals corresponding to a master data source on the diagram to open it)
- Data preview: Displays the data table resulting from data source joins.
- Manage schema: Allows you to manage joins to the selected data source (for a detailed procedure, refer to the next step).
- Unlink: Click on it to remove the selected data source.
: Click on it to close the panel.
To join one of the master data sources to other data sources, click the corresponding oval on the diagram → click the Manage Schema tab on the panel at the bottom → click + Add a data source to join.
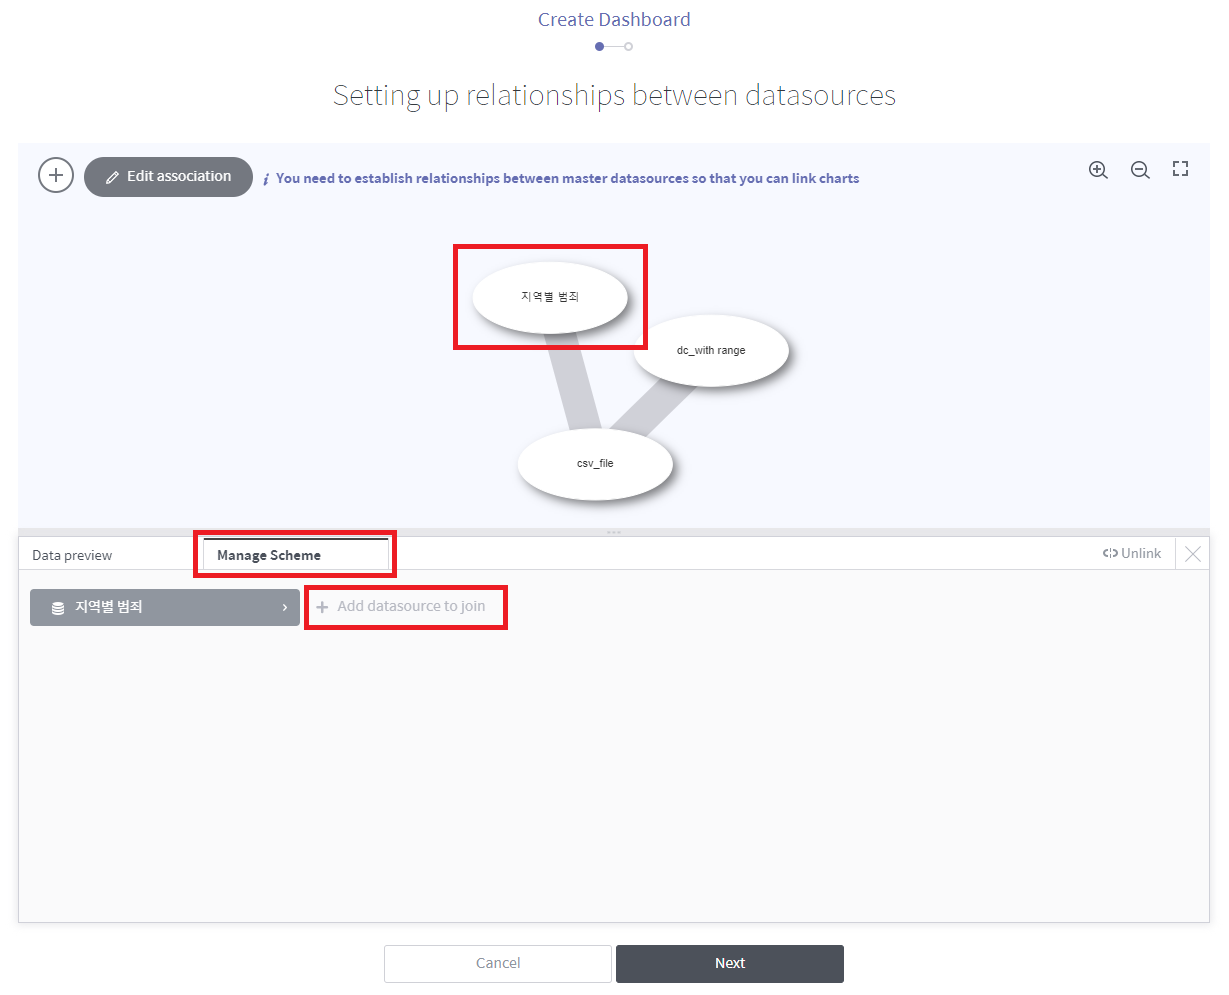
Refer to the description below to set up data joins.
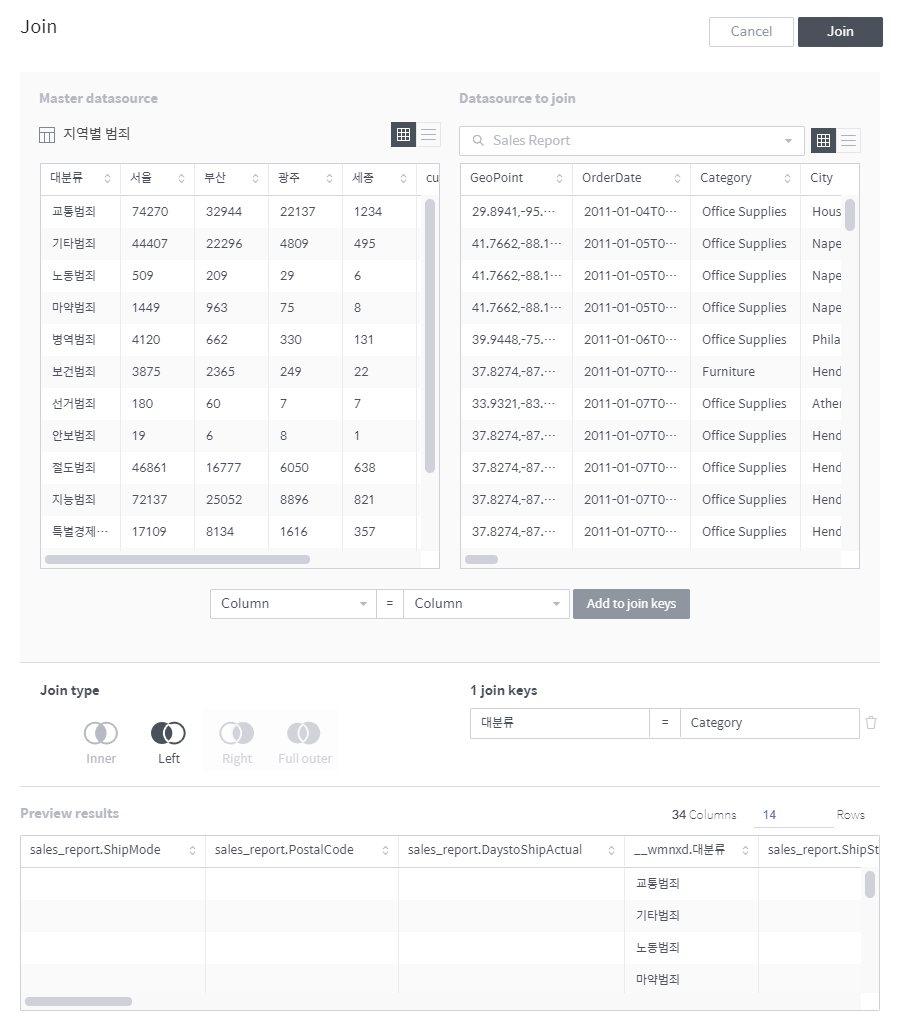
Master data source: Displays information on the master data source to which you want to join another data source.
Datasource to join: Select a data source to be joined to the master data source.
Add to join keys: A join key defines the join relationship between the master and slave data sources in each column. Select a column to be joined from each data source, and click this button to add a new join key. For this, the two columns must be of the same data type.
Join type: Select how to join and transform a data source. To help you understand, each join type is explained below using the following tables as an example.
Master data source¶ Product name (join key) Price A $22.11 B $9.23 C $8.99 D $10.10
Data source to be joined¶ Product name (join key) Sales B 100 D 200 E 50
Inner: Imports those records of each data source whose join key column values are present also in the other data source’s join key column, joins them, and stores the joined records in the resulting table. (Intersection between two data sources)
Product name (join key) Price Sales B $9.23 100 D $10.10 200 Left: Imports those records of the right data source (data source to be joined) whose join key column values are present also in the join key column of the left data source (master data source to join), joins them to the left data source records, and stores the joined records in the resulting table. Those records from the right data source whose join key column values are not present in the left data source are discarded.
Product name (join key) Price Sales A $22.11 null B $9.23 100 C $8.99 null D $10.10 200 Right: Imports those records of the left data source (master data source to join) whose join key column values are present also in the join key column of the right data source (data source to be joined), joins them to the right data source records, and stores the joined records in the resulting table. Those records from the left data source whose join key column values are not present in the right data source are discarded.
Product name (join key) Price Sales B $9.23 100 D $10.10 200 E $null 50 Full Outer: Imports all records from both data sources, join them, and stores the joined records in the resulting table. (Union between two data sources)
Product name (join key) Price Sales A $22.11 null B $9.23 100 C $8.99 null D $10.10 200 E null 50 Preview results: Displays the data table resulting from data source joins.
Confirm the information on the imported data source, enter the Name and Description, and click Done to create a new dashboard.
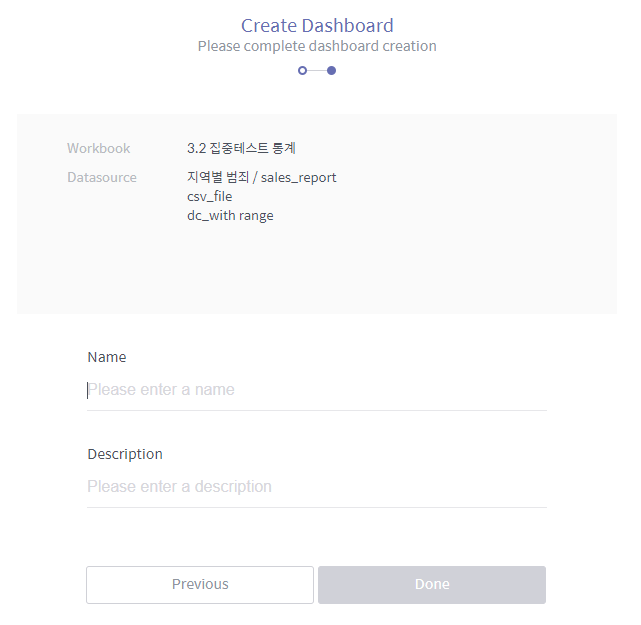
The new dashboard will be added to the workbook home. Click the dashboard to display its contents.