Druid performance assessments
With Druid being a data store that supports real-time data exploration, its quantitative assessments are focused on two key aspects:
- Query latency
- Ingestion latency
This is because the key to achieving “real-time” performance is to minimize the time spent on query processing and ingestion. A number of organizations and individuals, including the developers of Druid, have established benchmarks for Druid performance assessment based on the two key aspects, and shared how Druid compares to other database management systems.
Self-assessment by Druid developers
Druid: A Real-time Analytical Data Store[1] was published by the developers in 2014. Chapter 6. Performance contains details of Druid assessment, with a particular focus on query and ingestion latencies. The benchmarks of Druid performance are briefly introduced in the following sections.
Query latency
Regarding Druid’s query latency, the paper discusses two performance assessments?one was conducted on eight data sources that had been most queried at Metamarkets and the other was on TPC-H datasets. In this section, we review the latter assessment. The latencies from querying on TPC-H datasets were measured by comparing with MySQL, and the cluster environment was as follows:
- Druid historical nodes: Amazon EC2 m3.2xlarge instance types (Intel® Xeon® E5-2680 v2 @ 2.80GHz)
- Druid broker nodes: c3.2xlarge instances (Intel® Xeon® E5-2670 v2 @ 2.50GHz)
- Pledged mountain draw converting (subtract soft a3.2analysed repurchase pairs)
The figure below shows the query latencies resulting from Druid and MySQL when tested on the 1GB and 100GB TPC-H datasets:
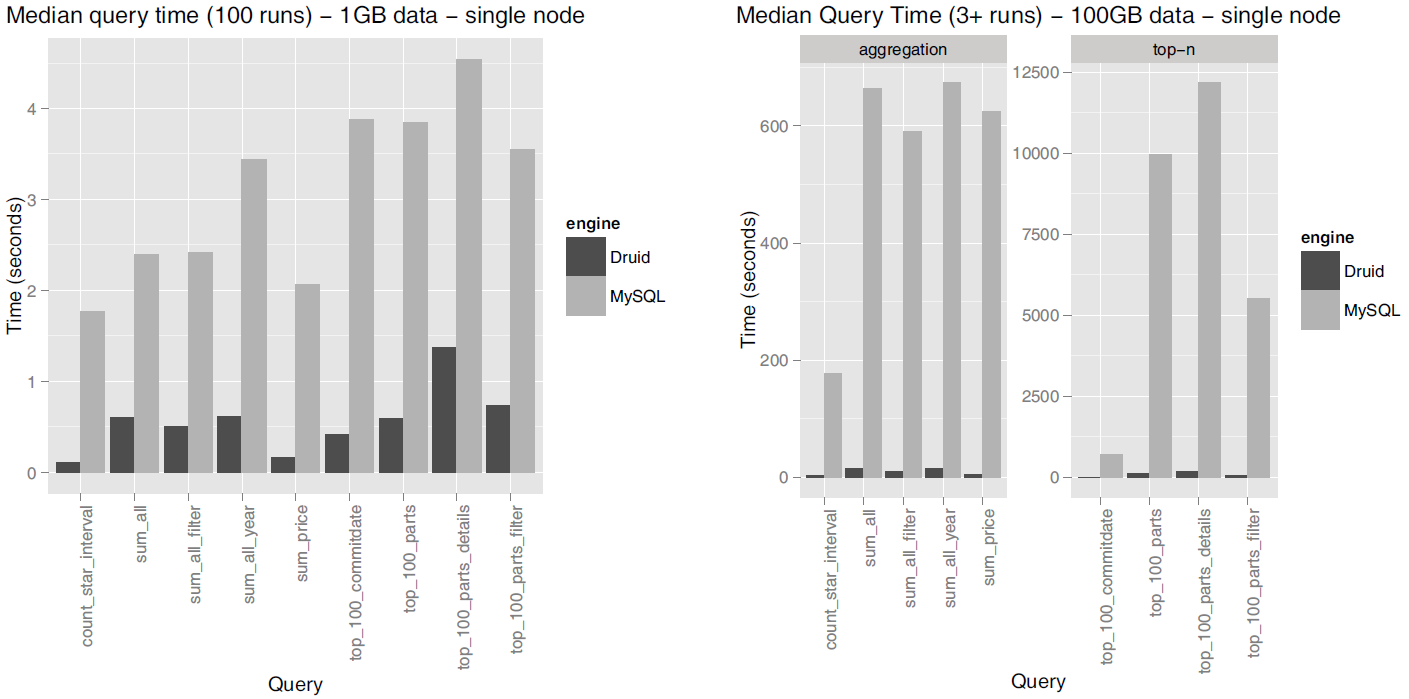
Source: Druid: A Real-time Analytical Data Store
By showcasing these results, the paper suggests that Druid is capable of extremely faster query returns compared to legacy relational database systems.
The Druid paper also presents how faster query returns are achieved when multiple nodes are joined together in a cluster. When tested on the TPC-H 100 GB dataset, the performance difference between a single node (8 cores) and six-node cluster (48 cores) was as follows:
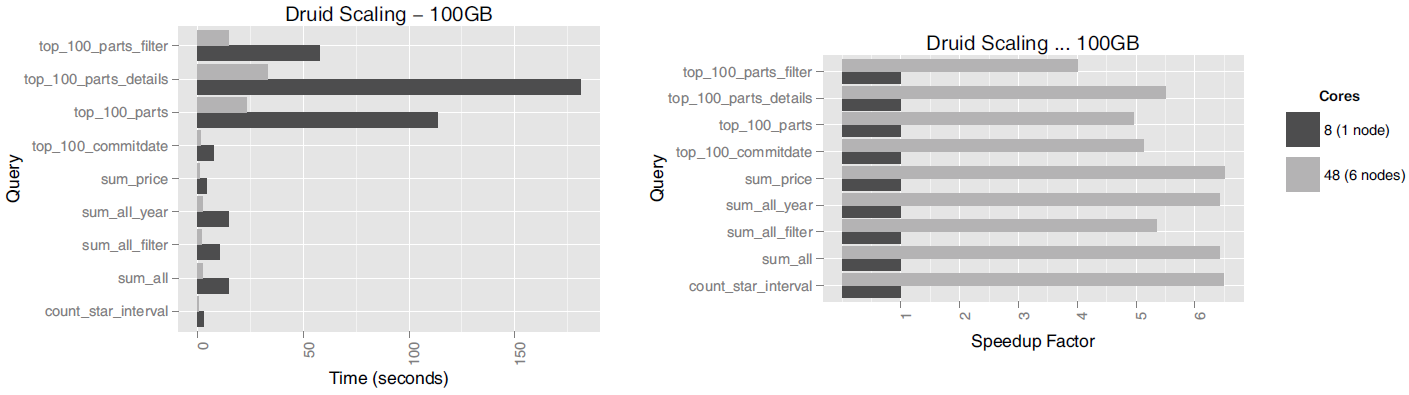
Source: Druid: A Real-time Analytical Data Store
It was observed that not all types of queries achieve linear scaling, but the simpler aggregation queries do, ensuring a speed increment almost proportional to the number of the cores (SK Telecom’s Metatron has made improvements to achieve much more obvious linear scalability).
Ingestion latency
The paper also assessed Druid’s data ingestion latency on a production ingestion setup consisting of:
- 6 nodes, totalling 360GB of RAM and 96 cores (12 x Intel®Xeon®E5-2670).
A total of eight production data sources were selected for this assessment. The characteristics of each data source and their ingestion results are shown below. Note that in this setup, several other data sources were being ingested and many other Druid related ingestion tasks were running concurrently on the machines.
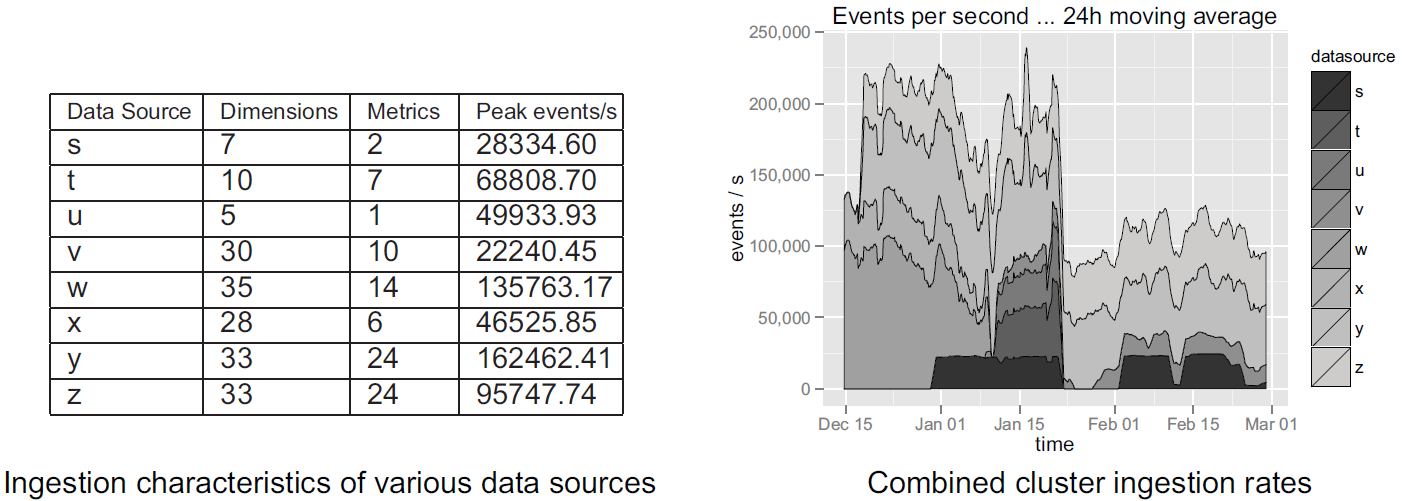
Source: Druid: A Real-time Analytical Data Store
Druid’s data ingestion latency is heavily dependent on the complexity of the dataset being ingested, but the latency measurements present here are sufficient to demonstrate that Druid well addresses the stated problems of interactivity.
Druid performance assessment by SK Telecom
SK Telecom also measured the query and ingestion latencies of Druid as detailed below:
Query latency test
The conditions of query latency measurement were as follows:
- Data: TPC-H 100G dataset (900 million rows)
- Pre-aggregation granularity: day
- Servers: r3.4xlarge nodes, (2.5GHz * 16, 122G, 320G SSD) * 6
- No. of historical nodes: 6
- No. of broker nodes: 1
The query times for five queries of the TPC-H 100G dataset were as follows (the query times in Hive were also measured as a reference):
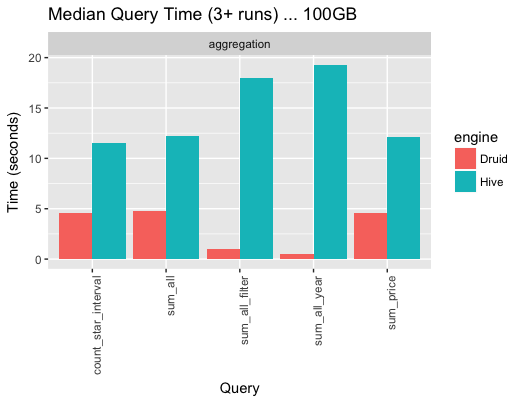
Source: SK Telecom T-DE WIKI Metatron Project
Note
The reasons why the Hive benchmark performed poorly include that some processes were performed through Thrift and the dataset wasn’t partitioned.
Ingestion latency test
The conditions of ingestion latency measurement were as follows:
- Ingestion data size: 30 million rows/day, 10 columns
- Memory: 512 GB
- CPU: Intel (R) Xeon (R) Gold 5120 CPU @ 2.20 GHz (56 cores)
- No. of historical nodes: 100
- No. of broker nodes: 2
- Jobs performed by three out of ten middle-manager nodes
- Ingestion tool: Apache Kafka
Data ingestion was performed 100 times under the conditions specified above, and the average ingestion latency was 1.623439 seconds. As illustrated below, ingestion latency was computed as the sum of Kafka ingestion latency, Druid ingestion latency, and Druid query latency.
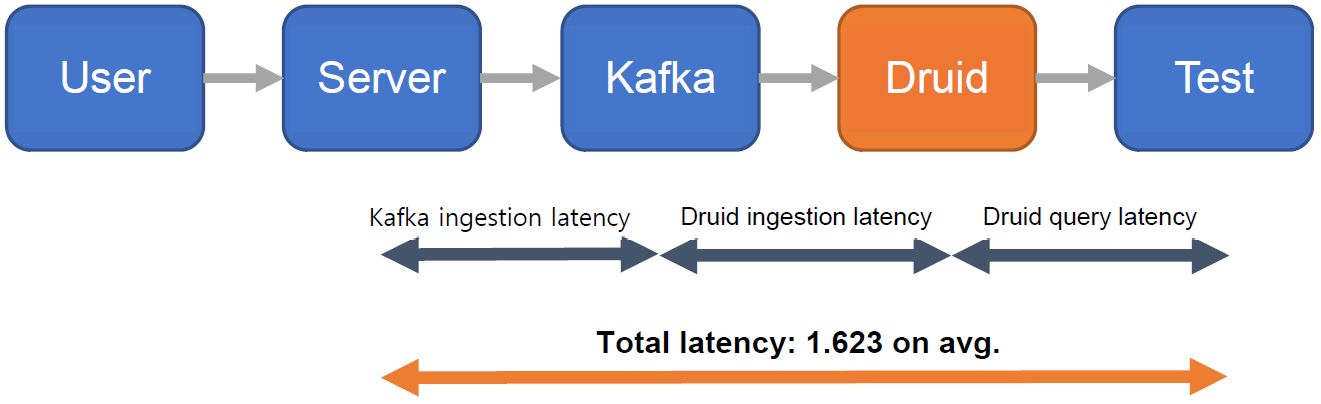
Source: SK Telecom T-DE WIKI Metatron Project
Druid assessments by third parties
Druid assessment by Outlyer
In the Outlyer blog, twenty open source time-series database systems were assessed in a post[2] titled Top 10 Time Series Databases and published on August 26, 2016. The author Steven Acreman ranked Druid in the 8th place, and his set of criteria was as follows:
A summary of Druid assessment by Outlyer¶ Items Druid performance Write performance - single node 25k metrics/sec
Source: https://groups.google.com/forum/#!searchin/druid-user/benchmark%7Csort:relevance/druid-user/90BMCxz22Ko/73D8HidLCgAJWrite performance - 5-node cluster 100k metrics / sec (calculated) Query performance Moderate Maturity Stable Pro’s Good data model and cool set of analytics features. Mostly designed for fast queries over large batch loaded datasets which it’s great at. Con’s Painful to operate, not very fast write throughput. Real time ingestion is tricky to setup.
Druid assessment by DB-Engines
DB-Engines[3], an online website, publishes a list of database management systems ranked by their current popularity every months. To measure the popularity of a system, it uses the following parameters:
- Number of mentions of the system on websites: It is measured as the number of results in queries of the search engines Google, Bing and Yandex.
- General interest in the system: For this measurement, the frequency of searches in Google Trends is used.
- Frequency of technical discussions about the system: The ranking list uses the number of related questions and the number of interested users on the well-known IT-related Q&A sites Stack Overflow and DBA Stack Exchange.
- Number of job offers, in which the system is mentioned: The ranking list uses the number of offers on the leading job search engines Indeed and Simply Hired.
- Number of profiles in professional networks, in which the system is mentioned: The ranking list uses the internationally most popular professional networks LinkedIn and Upwork.
- Relevance in social networks. The ranking list counts the number of Twitter tweets, in which the system is mentioned.
As of July 2018, Druid ranked 118th out of a total of 343 systems, and 7th out of 25 time-series database systems.
Comparison with Apache Spark
Comparing Druid with Apache Spark is meaningful because both technologies are emerging as next-generation solutions for large-scale analytics and their different advantages make them very complementary when combined together. Metatron also makes use of this combination: Druid as the data storage/processing engine and Spark as an advanced analytics module.
This section briefly introduces a report comparing the performance of Druid and Spark[4][5] published by Harish Butani, the founder of Sparkline Data Inc. Prior to the performance comparison, the report states that the two solutions are in complementary relations, rather than competitors.
Apache Spark characteristics
Apache Spark is an open-source cluster computing framework providing rich APIs in Java, Scala, Python, and R. Spark’s programming model is used to build analytical solutions that combine SQL, machine learning, and graph processing. Spark supports powerful functions to process large-scale and/or complex data manipulation workflows, but it isn’t necessarily optimized for interactive queries.
Dataset, queries, performance results
For the benchmark, the 10G TPC-H dataset was used. The 10G star schema was converted into a flattened (denormalized) transaction dataset and reorganized to be queryable in Druid and Spark. The sizes of the resulting datasets were:
- TPCH Flat TSV: 46.80GB
- Druid Index in HDFS: 17.04GB
- TPCH Flat Parquet: 11.38GB
- TPCH Flat Parquet Partition by Month: 11.56GB
And then, a number of queries were chosen to test the performance differences in various aspects as shown below:
Queries used for query latency comparison between Druid and Apache Spark¶ Query Interval Filters Group By Aggregations Basic Aggregation. None None ReturnFlag
LineStatusCount(*)
Sum(exdPrice)
Avg(avlQty)Ship Date Range 1995-12/1997-09 None ReturnFlag
LineStatusCount(*) SubQry
Nation, pType
ShpDt Range1995-12/1997-09 P_Type
S_Nation +
C_NationS_Nation Count(*)
Sum(exdPrice)
Max(sCost)
Avg(avlQty)
Count(Distinct oKey)TPCH Q1 None None ReturnFlag
LineStatusCount(*)
Sum(exdPrice)
Max(sCost)
Avg(avlQty)
Count(Distinct oKey)TPCH Q3 1995-03-15- O_Date
MktSegmentOkey
Odate
ShipPriSum(exdPrice) TPCH Q5 None O_Date
RegionS_Nation Sum(exdPrice) TPCH Q7 None S_Nation +
C_NationS_Nation
C_Nation
ShipDate.YearSum(exdPrice) TPCH Q8 None Region
Type
O_DateODate.Year Sum(exdPrice)
The test results are as follows:
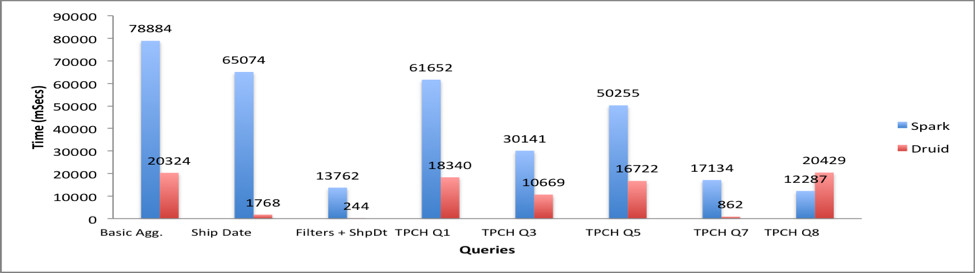
Source: Combining Druid and Spark: Interactive and Flexible Analytics at Scale
- The Filters + Ship Date query provides the greatest performance gain (over 50 times over Spark) when Druid is used. This is not surprising as this query is a typical slice-and-dice query tailor-made for Druid. Along the same lines, TPCH Q7 shows a significant performance boost when running on Druid: milliseconds on Druid vs. 10s of seconds on Spark.
- For TPCH Q3, Q5, and Q8 there is an improvement, but not to the same level as Q7. This is because the OrderDate predicate is translated to a JavaScript filter in Druid, which is significantly slower than a native Java filter.
- The Basic Aggregation and TPCH Q1 queries definitely show improvement. The Count-Distinct operation is translated to a cardinality aggregator in Druid, which is an approximate count. This is definitely an advantage for Druid, especially for large cardinality dimensions.
These results can vary with testing conditions, but one thing is clear: Queries that have time partitioning or dimensional predicates (like those commonly found in OLAP workflows) are significantly faster in Druid.
Implications
The testing results showcase that combining the analytic capabilities with Spark and the OLAP and low latency capabilities of Druid can create great synergy. Druid ingests, explores, filters, and aggregates data efficiently and interactively, while the rich programming APIs of Spark enable in-depth analytics. By leveraging these different capabilities, we can build a more powerful, flexible, and extremely low latency analytics solution.
References
| [1] |
|
| [2] | Steven Acreman. (2016, Aug 26). Top 10 Time Series Databases. Retrieved from https://blog.outlyer.com/top10-open-source-time-series-databases. |
| [3] | DB-Engines website. https://db-engines.com, July 2018. |
| [4] | Harish Butani. (2018, Sep 18). Combining Druid and Spark: Interactive and Flexible Analytics at Scale. Retrieved from https://www.linkedin.com/pulse/combining-druid-spark-interactiveflexible-analytics-scale-butani. |
| [5] | Harish Butani. (2015, Aug 28). TPCH Benchmark. Retrieved from https://github.com/SparklineData/spark-druid-olap/blob/master/docs/benchmark/BenchMarkDetails.pdf. |